|
3
min read
The rapid shift in user behavior towards more intuitive, adaptive, and AI-driven solutions has significantly increased the demand for innovative generative AI tools, as traditional UI/UX methodologies, while still valuable, often lack the speed, flexibility, and intuitive responsiveness required by today’s digitally transforming users and organizations. Bridging this gap is Dualite Alpha, a cutting-edge generative AI tool that empowers creators to rapidly prototype fully responsive, interactive, and modern UI designs, minimizing reliance on conventional, time-consuming methods and enabling faster iterations, smarter interactions, and enhanced user satisfaction.
In this tutorial, we will leverage Dualite Alpha to build a fully responsive Finance Dashboard. We'll showcase how easy it is to translate your ideas into functional, visually appealing interfaces that deliver impactful insights at a glance.
What Is a Finance Dashboard?
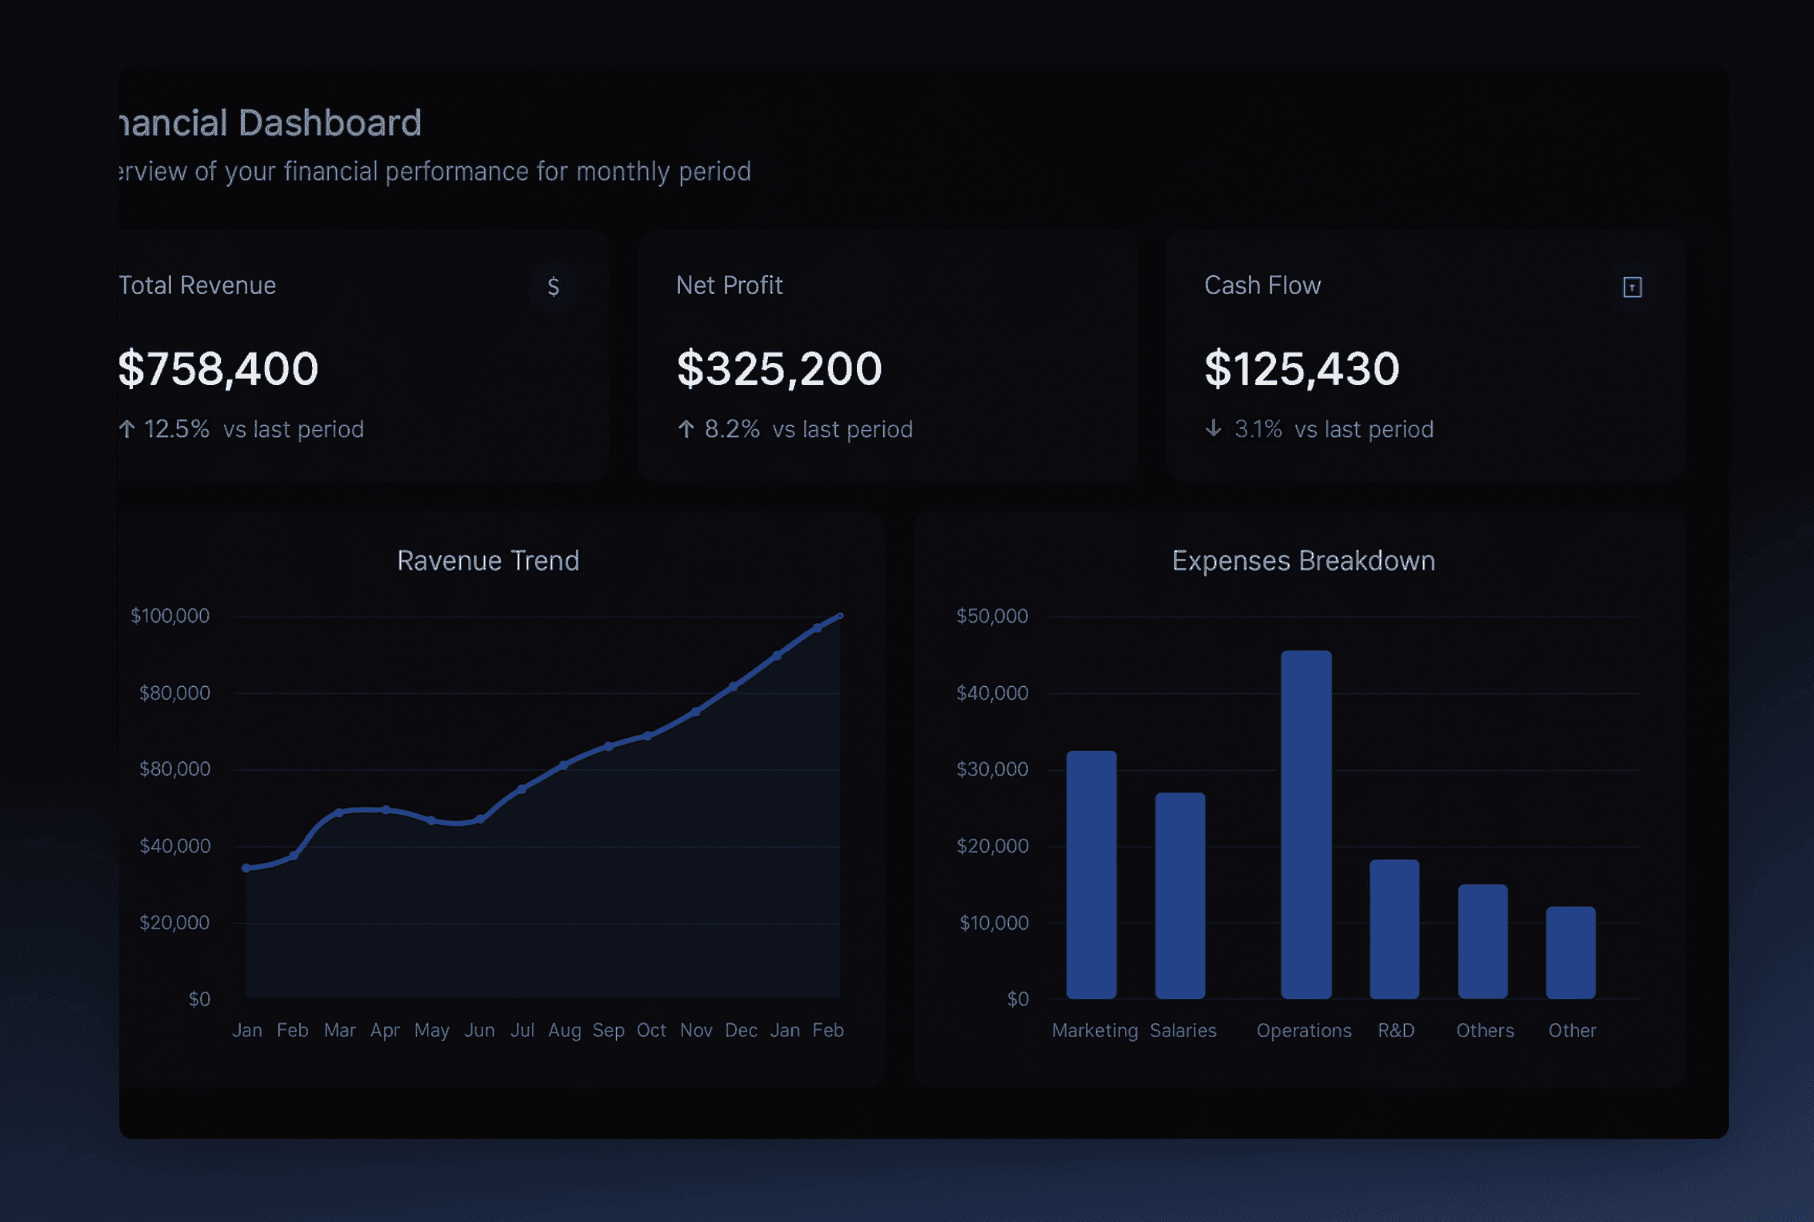
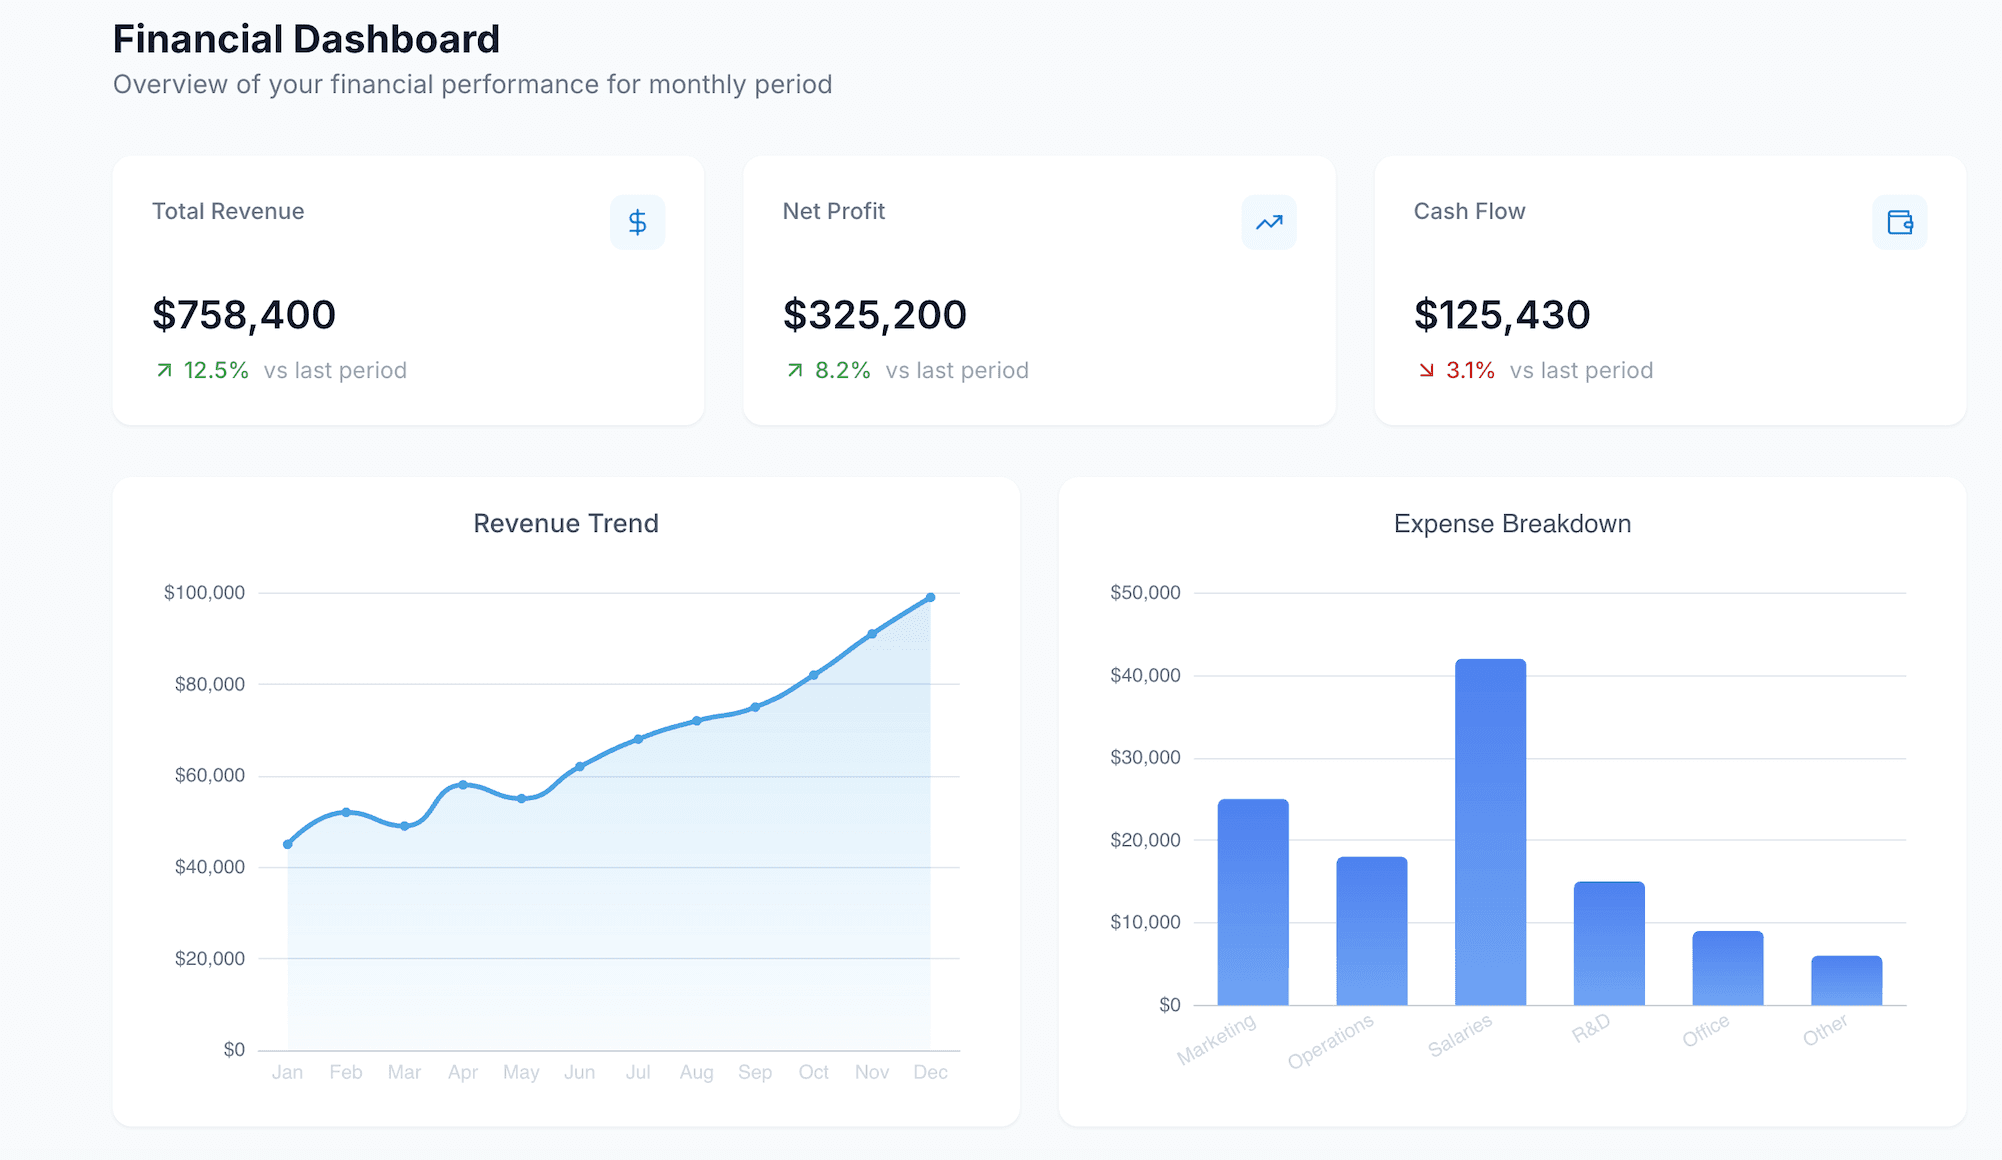
A finance dashboard is an interactive visual interface displaying key financial metrics and insights. It offers an at-a-glance view of performance indicators like Total Revenue, Net Profit, and Cash Flow, making it easier to track progress and identify trends quickly.
Essential Components of a Finance Dashboard
Every effective finance dashboard UI should contain:
Key Metrics (KPIs): Highlight Total Revenue, Net Profit, and Cash Flow for immediate insights.
Interactive Visualizations: Utilize line charts for revenue trends, bar charts for expense comparisons, and pie charts for budget allocations.
Dynamic Data Table: Include sortable and filterable tables for detailed financial data analysis.
Step-by-Step Tutorial to Create Your Finance Dashboard UI
Step 1: Sign up and Onboarding
The first step is simple. Visit dualite.dev for a free account and join the waitlist. After you've signed up for the waitlist, you'll receive an email with the access link. You need to click on that link to start using Alpha.
Step 2: Describe your Project
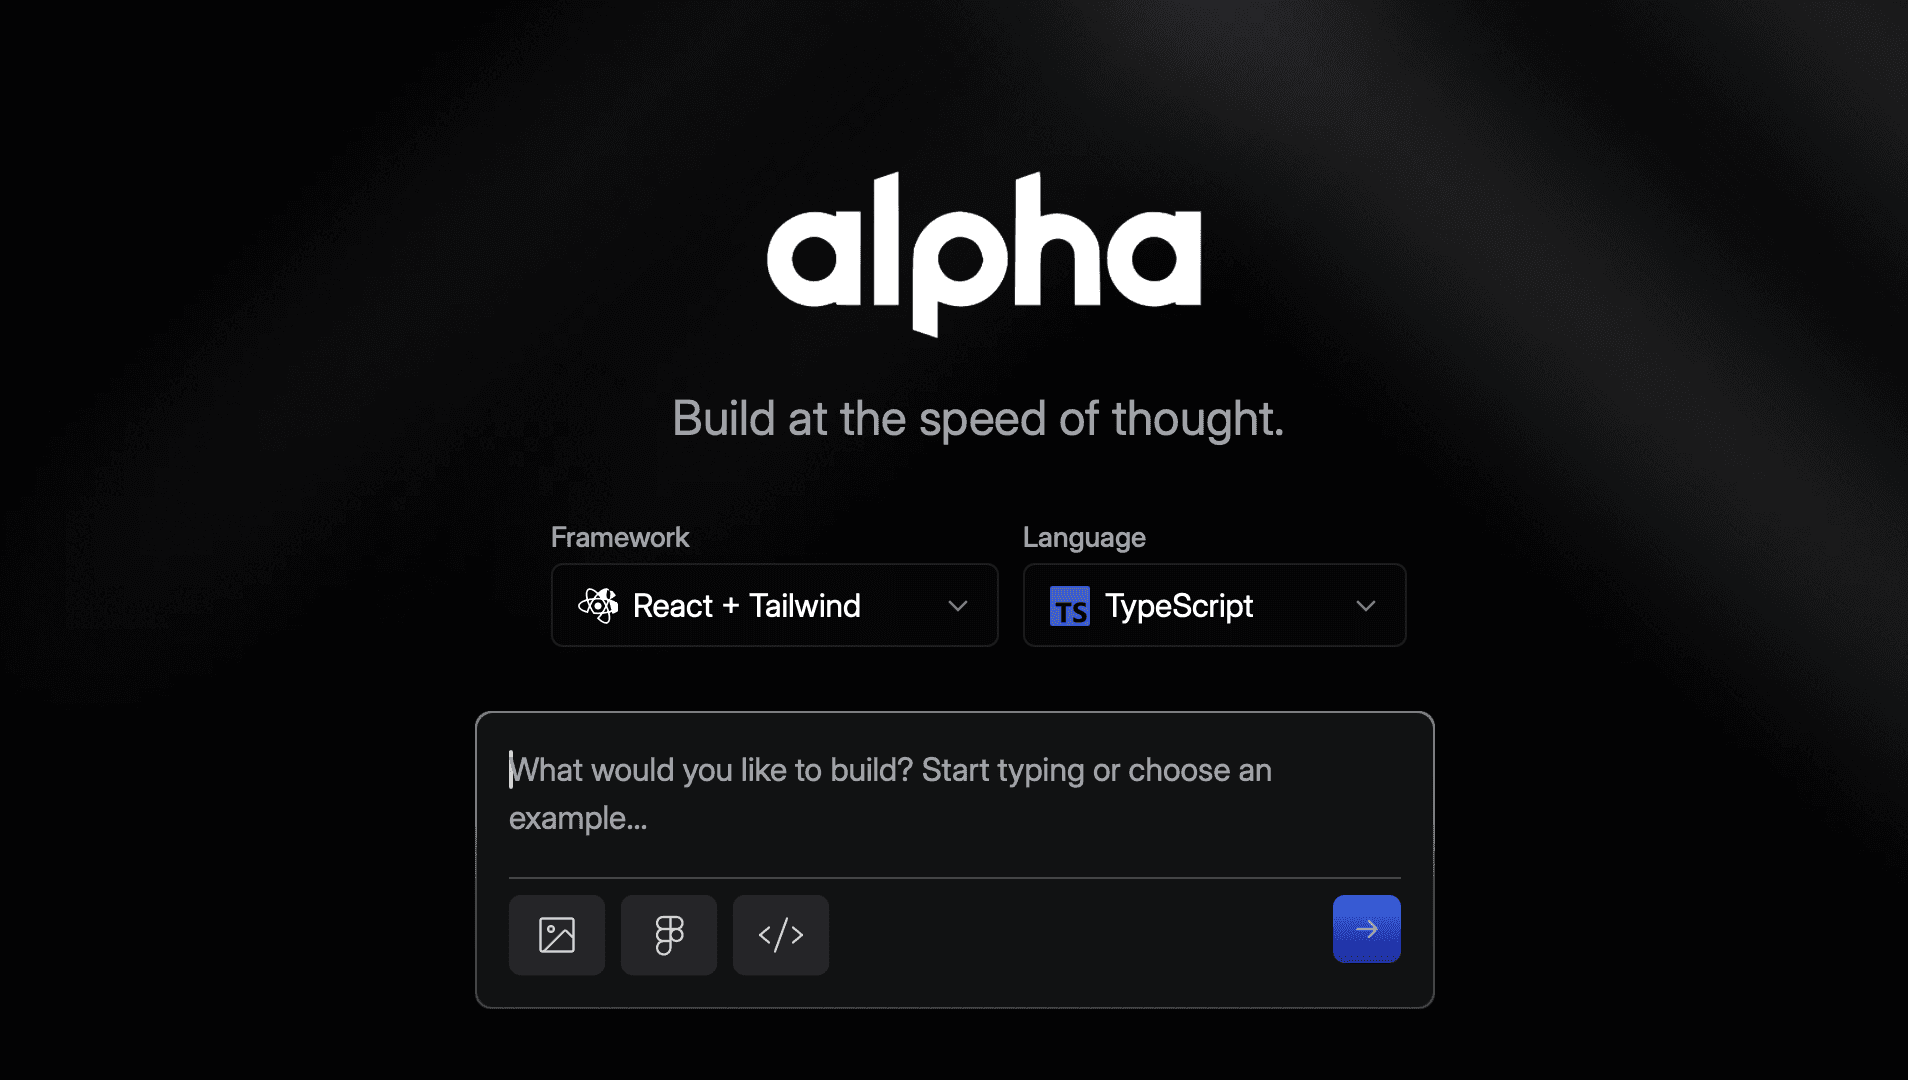
Once logged in, you’ll be greeted with a prompt asking you to describe what you want to build. Use natural language and clear and concise words to detail your idea. For instance, you might type:
“Design a sleek, modern finance dashboard UI featuring a header with key metrics (Total Revenue, Net Profit, Cash Flow), a sidebar with filtering options, and a main area displaying interactive charts (line, bar, and pie) alongside a dynamic data table—all optimized for responsive, intuitive navigation.”
This simplicity is what sets Dualite apart — it understands your requirements and gets started without the need for extensive technical jargon.
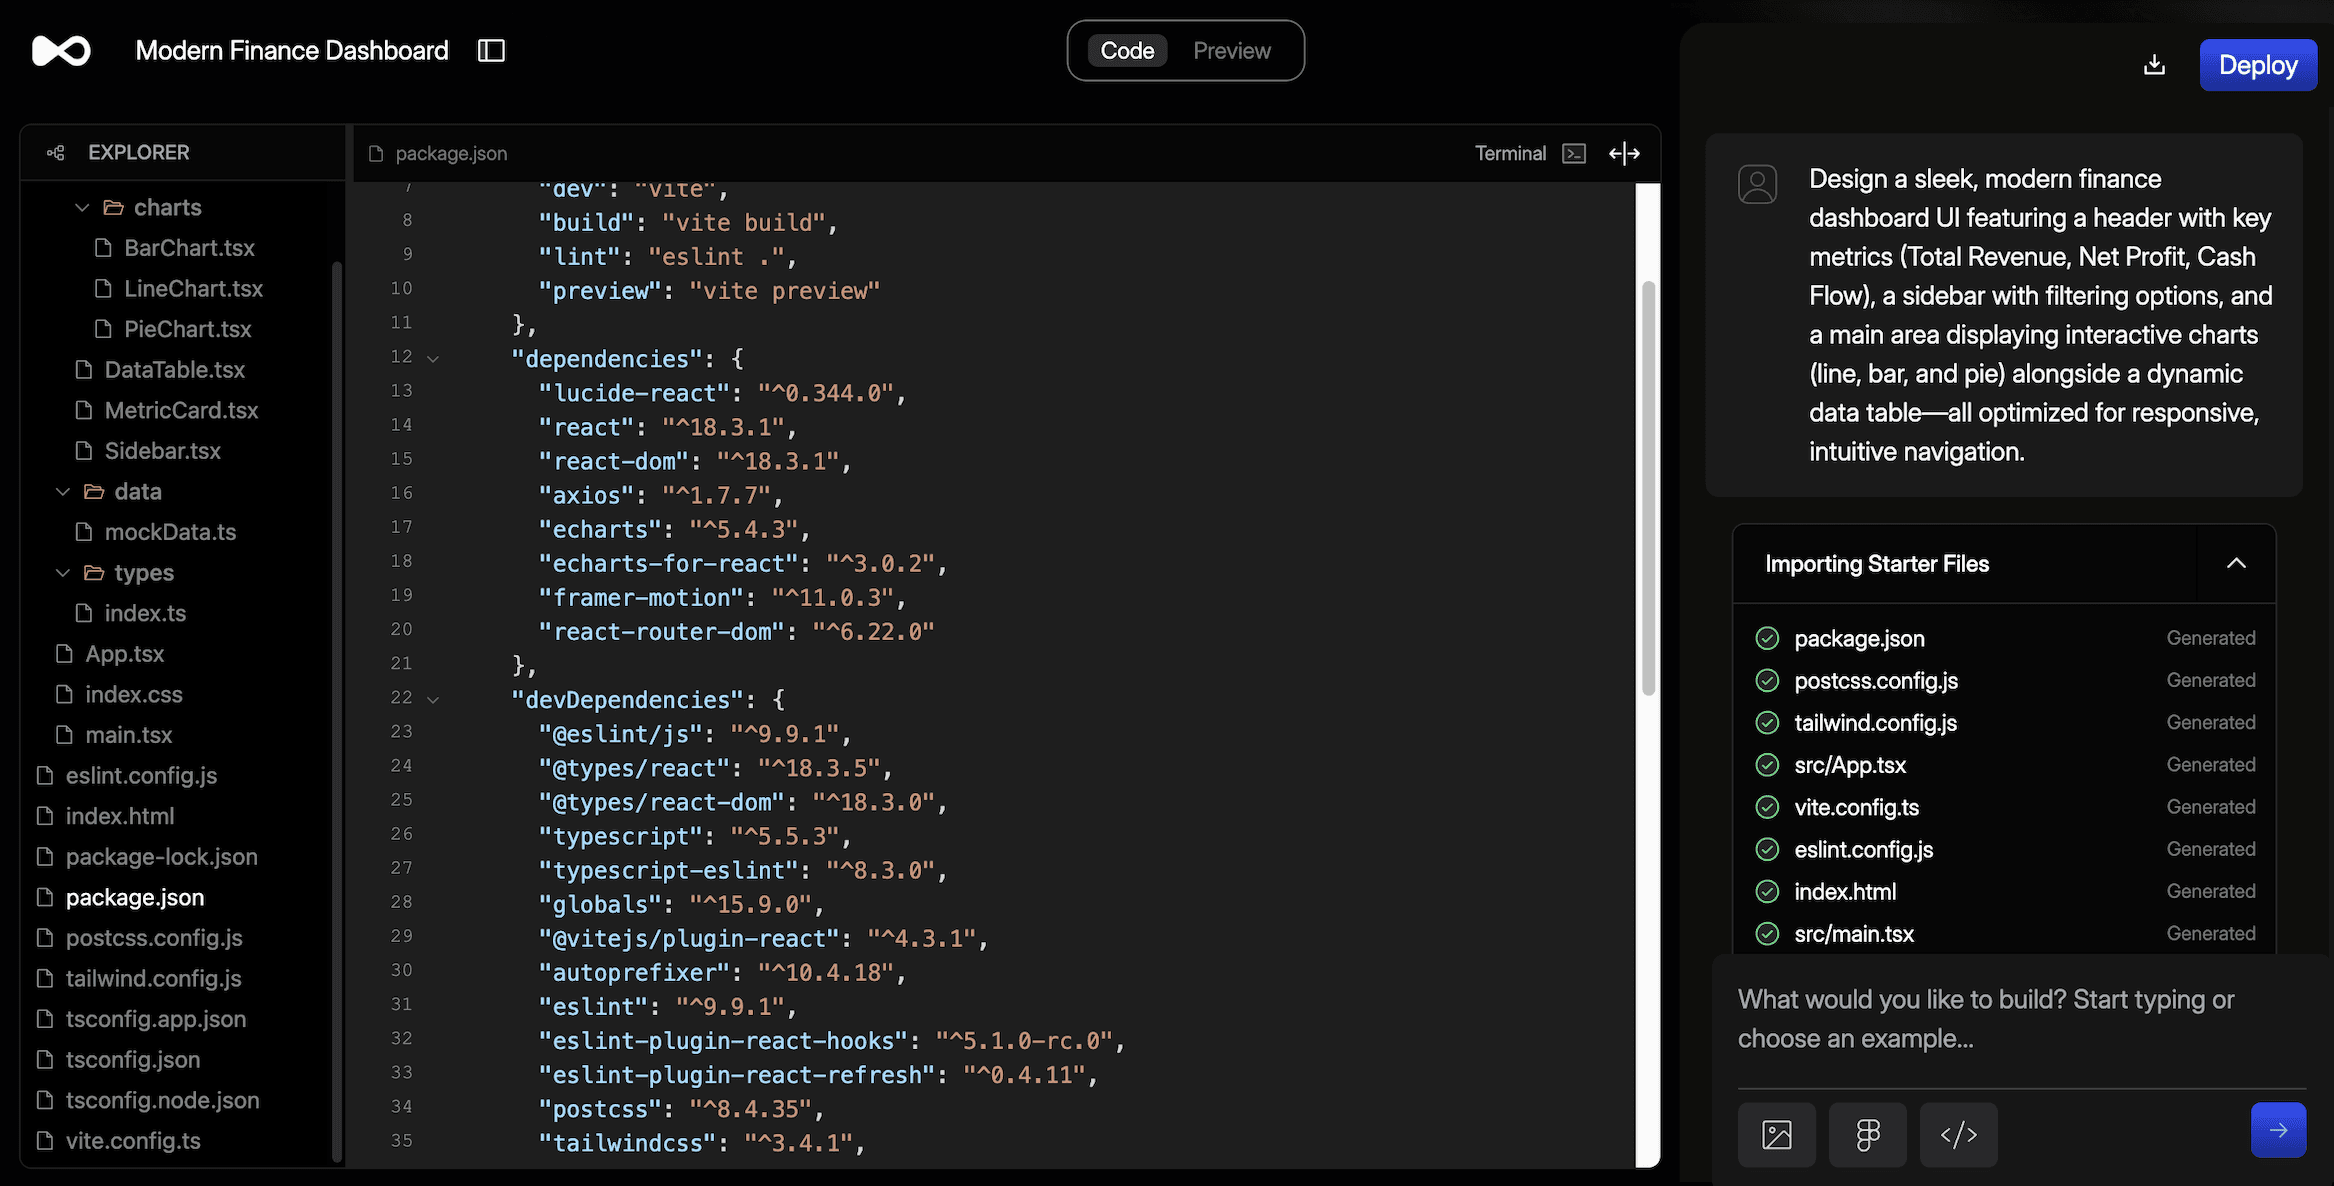
Step 3: Customise the Generated Code
After the initial code is generated, you have the freedom to customize every aspect of your site. Use the built-in chat at the bottom right, to tweak the design, adjust layouts, and refine functionalities. Dualite offers features like instant preview, live rendering, and an easy-to-use undo mechanism, which makes experimenting with design changes both safe and fun.
Step 4: Deploy your website
When you’re content with the website generated, you can deploy it to a hosting platform (here, netlify). Click the “deploy” button on the top right corner. You’ll be landed on a page, where you will be asked to connect with your Netlify account.
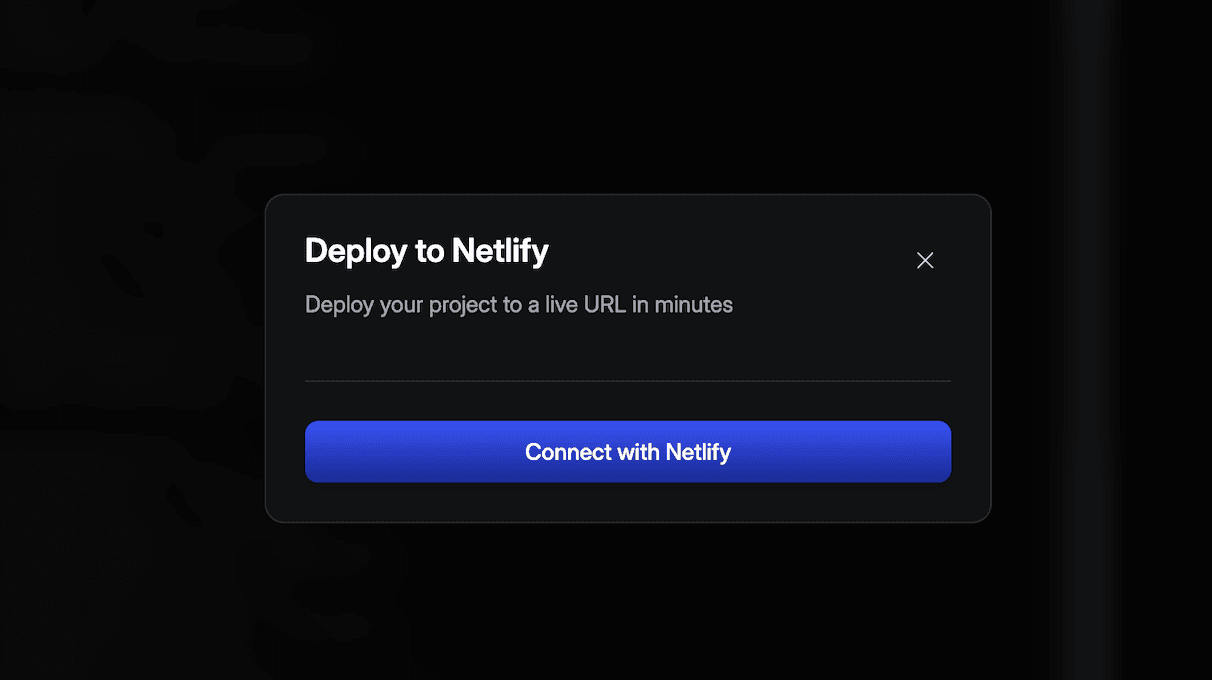
Once you log into your Netlify account, and authorize the application, you can easily see the deployment process in action.
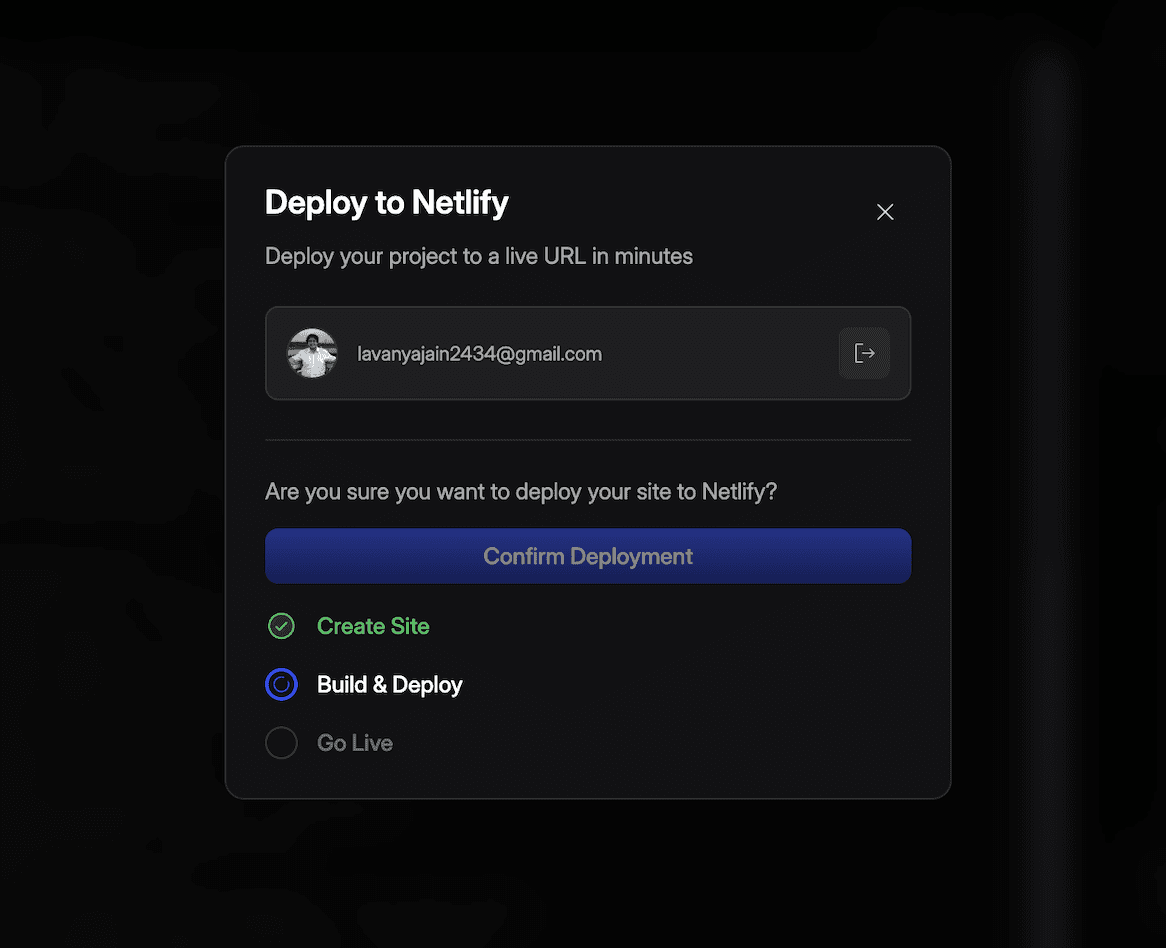
Confirm the deployment and voila, you have built yourself a finance dashboard using Dualite Alpha. It’s that EASY. (Check out the project using this link)
Integrations and API Compatibilities
APIs are the bread and butter of any organization of any scale. They are the sets of rules and specifications that allow different software applications to communicate and exchange data. So, it becomes vital to allow API Integration into your app or project.
Integration using third-party services, APIs, and databases is essential to building a feature-rich website. Dualite makes these integrations effortless. For instance, you can instruct Dualite to integrate finance APIs, social media APIs, or data analytics tools directly into your project. This capability not only saves time but also ensures that your website is fully equipped to interact with external services.
You can even import your Figma file, and attach any image or document preview into your project.
Conclusion and Next Steps
You've now learned how to create a sleek, modern finance dashboard UI that communicates financial insights. Keep refining your dashboard based on user feedback and explore advanced functionalities like predictive analytics for deeper financial insights.
Start building your interactive finance dashboard today and empower your financial decision-making process! Sign up today.